Texas Children's Pediatrics Baytown
Hours
| Mon | 8 AM – 5 PM |
|---|---|
| Tue | 8 AM – 5 PM |
| Wed | 8 AM – 5 PM |
| Thu | 8 AM – 5 PM |
| Fri | 8 AM – 5 PM |
| Sat | Closed |
| Sun | Closed |
 Illustration
Growth charts show patterns, not grades. What matters most is how your child tracks over time and what the pediatrician sees alongside height, weight, development and family history.
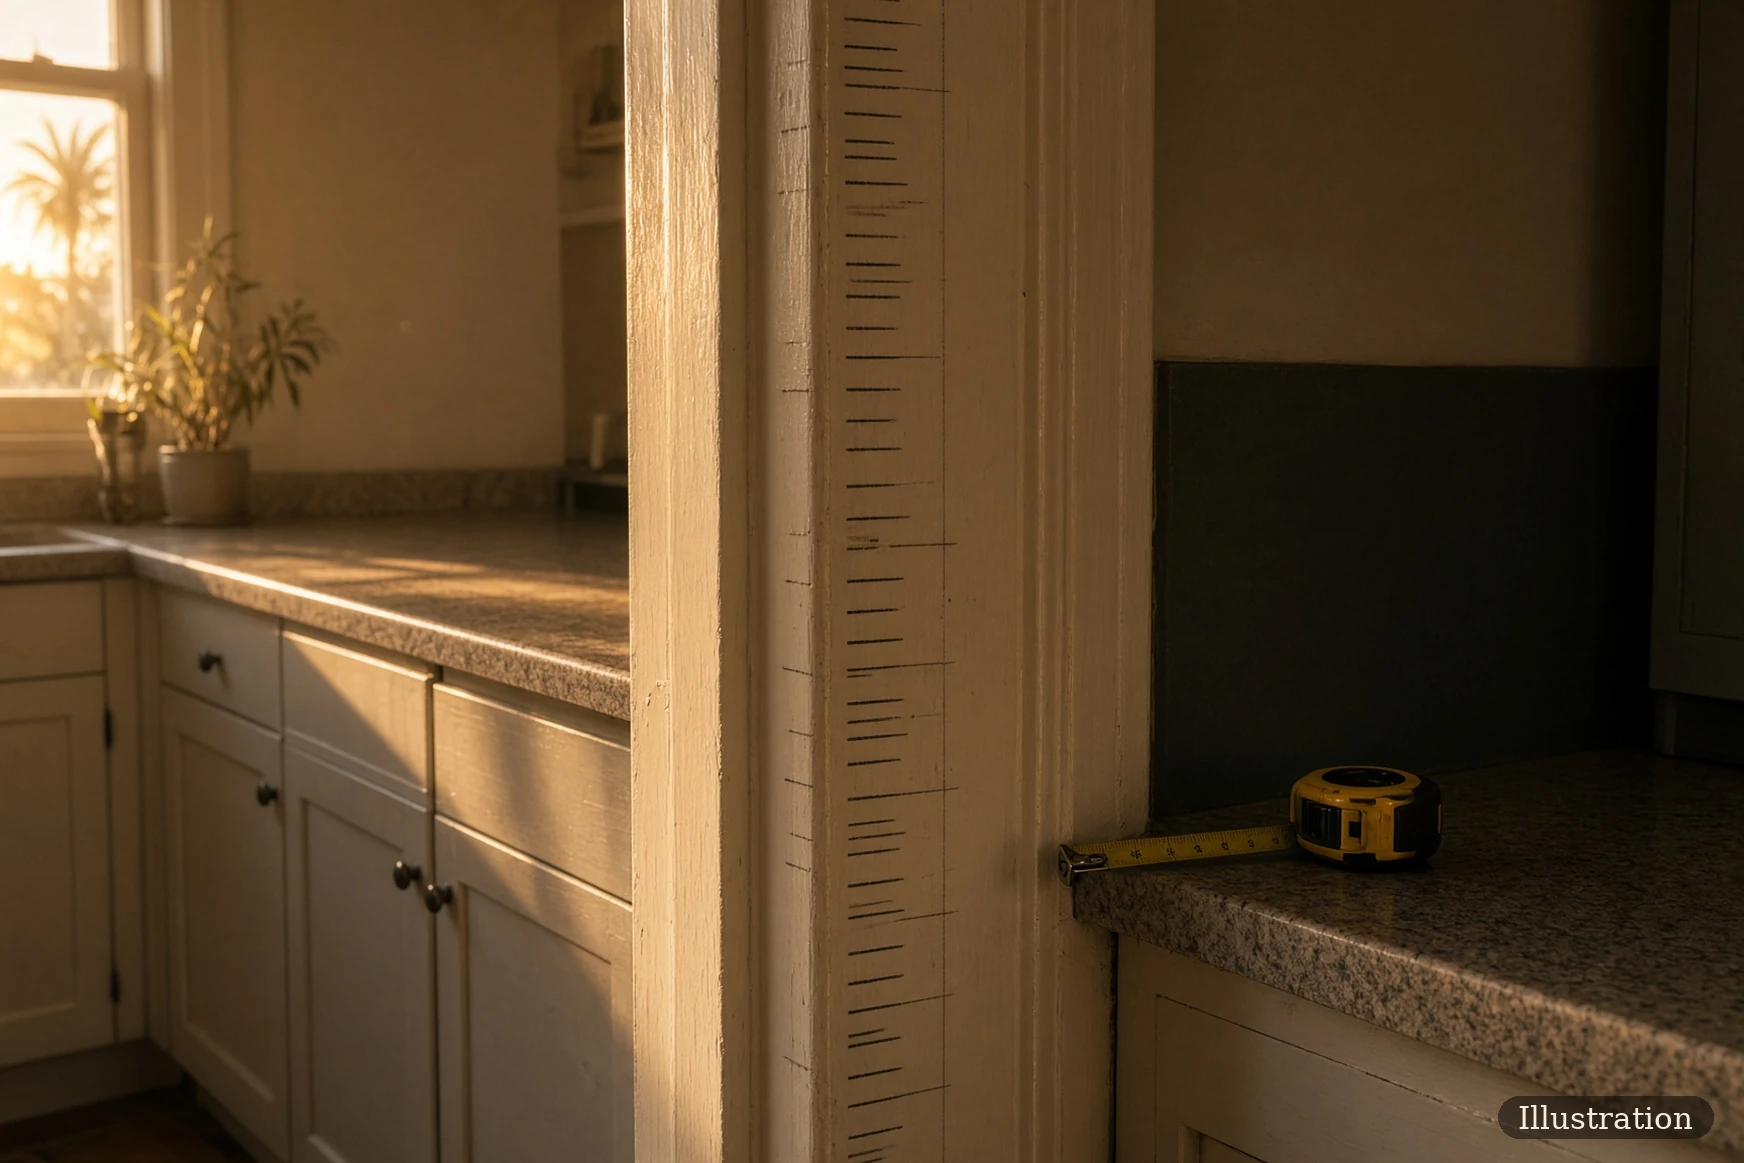
Every family has the doorframe: the pencil marks, the dates, the argument about whether shoes count. A growth chart is the doctor's version of the doorframe, and it's one of the most misunderstood pieces of paper in parenting.
If your child's weight is at the 40th percentile, it means that out of 100 children of the same age and sex, about 40 weigh less and about 60 weigh more. It isn't a grade. A child at the 10th percentile isn't doing worse than a child at the 90th; both can be perfectly healthy. As the American Academy of Pediatrics puts it, for growth "we hope for consistency."
What matters is the trend. One measurement is a snapshot; several over time show a pattern. A child who has followed roughly the same line for years is doing what their body does. If your child's line changes a lot between visits, climbing or falling across the chart, ask the pediatrician to explain it. That's exactly the question the chart exists to raise.
From age 2, the doctor also looks at BMI for age, which uses these CDC categories: under the 5th percentile is underweight; the 5th to under the 85th is a healthy weight; the 85th to under the 95th is overweight; the 95th and above is obesity. The CDC calls a BMI at 120 percent of the 95th percentile or more, or a BMI of 35 or more, severe obesity, and the calculator says so. In 2022 the CDC added extended charts for children with very high BMI, because the old charts ran out of room; for everyone else, the standard charts haven't changed.
For a baby, the WHO charts follow four things: weight for age, length for age, weight for length and head circumference for age. Under 2, length is measured lying down, which is why a nurse lays your baby along a measuring board rather than standing them up. At 2 the measurement switches to standing height, which reads a little lower than lying-down length (about a quarter inch, or 0.8 cm, according to the CDC), so a small step in the line at the switch is expected and isn't your child shrinking.
The WHO charts mark two outer lines at the 2nd and 98th percentiles (more exactly, the 2.3rd and 97.7th, which are two steps either side of the middle). The CDC treats weight for length below the 2nd or above the 98th as low or high, and that is a reason for the doctor to look more closely, not a diagnosis. Some doctors talk in z-scores instead of percentiles, which the AAP compares to a staircase: zero is the main floor, and a score of minus 2 is two steps down. Same idea, different ruler.
For children born preterm, early growth may need to be plotted with corrected age rather than chronological age. The American Academy of Pediatrics' current growth tools say to use corrected age for children born preterm until age 3.
The calculator on this page therefore needs one extra piece of information for a child born more than three weeks before the due date: the due date or gestational age at birth. If that information is not known, the calculator should withhold the percentile rather than guess.
Runs on your device. Nothing is sent or saved.
A percentile isn't a grade — the line over time is what matters. Bring these numbers to your child's doctor.
Enter your child's sex, date of birth, the date you measured, and the weight, length or height (and head size, under 2). The calculator uses the same WHO and CDC data your doctor's chart uses. It runs entirely on your phone or computer, and nothing you type is sent anywhere or saved. It shows a percentile, not a verdict: bring the number to your child's doctor, who knows the rest of the story.
Measuring at home is harder than it looks: a wiggly toddler, a soft carpet, a scale that isn't level. Small differences from the doctor's numbers are normal.
Every well-child visit is a measuring visit, so the first place to look is your pediatrician's office (how to choose one). The American Academy of Pediatrics schedule has a visit a few days after birth, by 1 month, and at 2, 4, 6, 9, 12, 15, 18, 24 and 30 months, then once a year from age 3, so a child ends up with about a dozen points on the chart by the third birthday. That is what makes a trend readable. In Baytown, that can mean Texas Children's Pediatrics Baytown on Garth Road, open weekdays 8 a.m. to 5 p.m. on the hours we hold, or Baytown Pediatrics on West Baker Road, which lists weekday mornings. Hummingbird Pediatrics on North Alexander Drive lists weekday hours of 9 a.m. to 5 p.m. and says it sees newborns and does well-child visits. Families using the county system can ask about the pediatrics services at the Harris Health Baytown Health Center, 1602 Garth Road, which is open weekdays 7 a.m. to 5 p.m.
At the visit, ask the nurse to show you the line. Most offices will point to where your child sat last time and where they sit now, and hearing it in that order is worth more than any number.
CDC, "Using the WHO Growth Charts" and "Growth Chart Training" (cdc.gov/growth-chart-training); CDC growth chart data files (cdc.gov/growthcharts, WHO and CDC LMS tables); CDC/NCHS National Health Statistics Report No. 63 (the LMS method); CDC, "BMI categories for children and teens"; CDC, extended BMI-for-age charts (2022); AAP HealthyChildren.org, "Growth Charts: By the Numbers"; AAP Term Infant Growth Tools and Preterm Infant Growth Tools (corrected age for children born preterm). Harris Health, Baytown Health Center.
Un percentil no es una calificación: un niño en el percentil 10 no está peor que uno en el 90. Lo que importa es la tendencia; si la línea de su hijo cambia mucho entre consultas, pregunte al pediatra. Del nacimiento a los 2 años se usan las tablas de la OMS, que miden la longitud acostado; de los 2 a los 20, las de los CDC. Desde los 2 años también se mira el IMC para la edad. Desde los 2 años, la calculadora también usa las tablas extendidas de IMC de los CDC cuando el IMC está en el percentil 95 o más. Si nació antes de tiempo, puede ser necesario usar la edad corregida. La calculadora pide la fecha probable de parto; si no se conoce, no inventa un percentil. Funciona en su teléfono y no guarda nada. Lleve el número al pediatra, por ejemplo a Texas Children's Pediatrics Baytown o a la clínica Harris Health Baytown Health Center.
| Mon | 8 AM – 5 PM |
|---|---|
| Tue | 8 AM – 5 PM |
| Wed | 8 AM – 5 PM |
| Thu | 8 AM – 5 PM |
| Fri | 8 AM – 5 PM |
| Sat | Closed |
| Sun | Closed |
| Mon | 8 AM – 12 PM, 1 PM – 5 PM |
|---|---|
| Tue | 8 AM – 12 PM, 1 PM – 5 PM |
| Wed | 8 AM – 12 PM, 1 PM – 5 PM |
| Thu | 8 AM – 12 PM, 1 PM – 5 PM |
| Fri | 8 AM – 12 PM, 1 PM – 5 PM |
| Sat | Closed |
| Sun | Closed |
| Mon | 9 AM – 5 PM |
|---|---|
| Tue | 9 AM – 5 PM |
| Wed | 9 AM – 5 PM |
| Thu | 9 AM – 5 PM |
| Fri | 9 AM – 5 PM |
| Sat | Closed |
| Sun | Closed |
Ours to fix
We read every one, and we write back when it's fixed.